With more than 500 Texas facilities now enrolled, the Quality Incentive Payment Program (QIPP) has quickly become one of the most important factors for SNF success in Texas.
To help our customers maximize QIPP results across all their facilities, SimpleLTC recently rolled out a QIPP analytics module built specifically for Texas. The new QIPP module works within the SimpleAnalyzer™ analytics platform, and is offered at no additional charge to all users of SimpleAnalyzer™.
As always, we continue working hard to improve all our products. So we’re pleased to announce a new updated to the resident-level analytics within the QIPP module that will make QIPP analysis simpler.
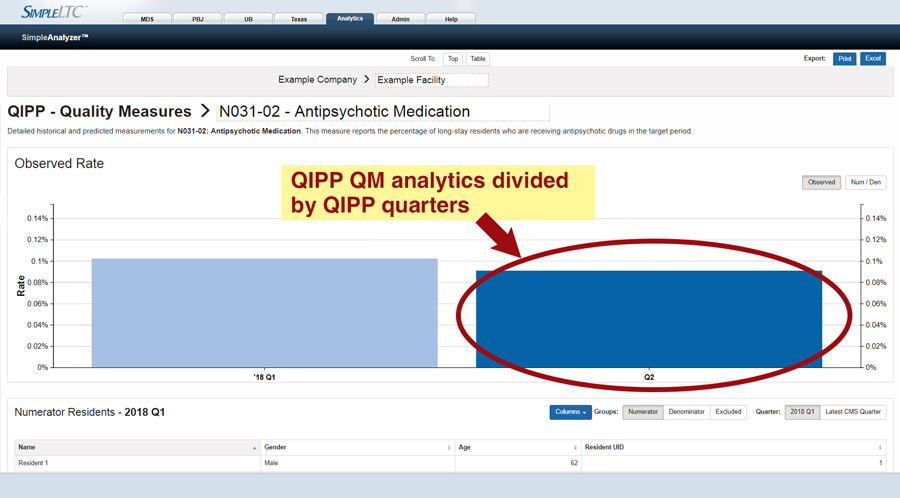
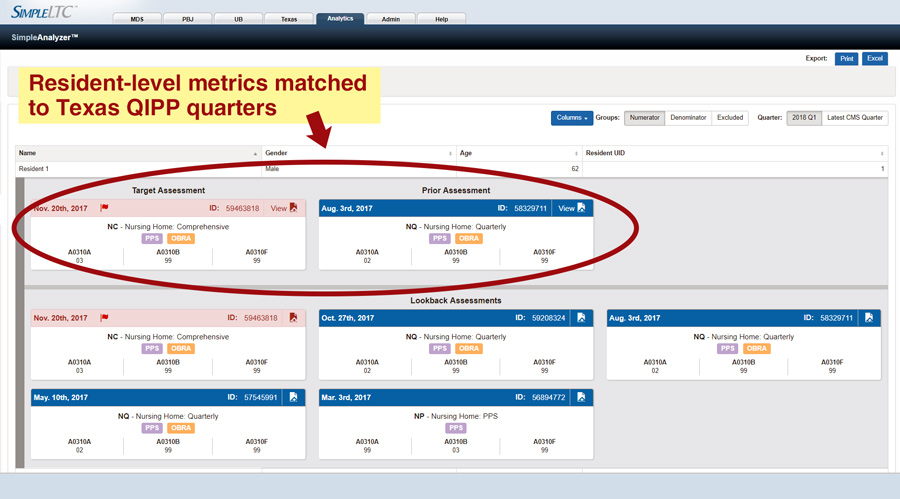
Now, when you drill down to the facility and resident level from any QIPP measure, the quarterly timeframes will correspond correctly to overall QIPP quarters. This makes it simpler to see how individual residents and MDS fields are directly affecting your QIPP results.

Texas QIPP analytics: quarterly QM details

Texas QIPP analytics: resident-level detail
We believe this enhancement will make your overall QIPP outcomes easier to understand and predict as you learn to navigate the new QIPP program.
About the new QIPP analytics
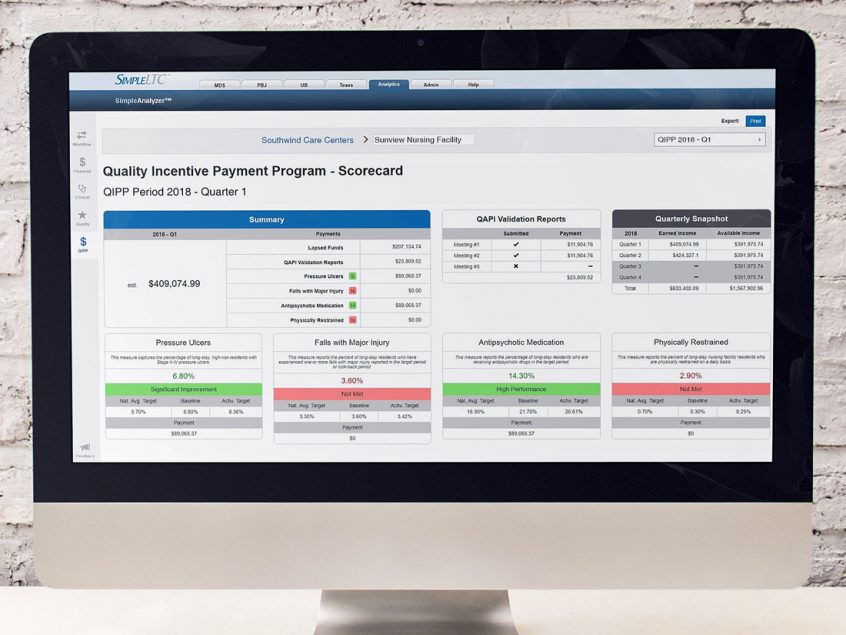
The SimpleAnalyzer™ QIPP analytics module is designed to help you maximize QIPP results across all your facilities. Within a simple dashboard, you’ll easily see predictive data for all four QIPP Quality Measures. Real-time metrics include resident data up to your most recently submitted MDS batches. You can easily estimate quarterly QIPP payments at the company or facility level, and quickly identify specific areas for rapid QIPP improvements.
With SimpleAnalyzer QIPP analytics you can:
- View simple summaries of QIPP calculations and payments.
- Analyze individual QIPP metrics and performance levels.
- Compare target levels, baseline and national averages.
- Pinpoint areas for rapid QIPP improvement.
- Drill down to resident-level QM assessment data.
Get your free QIPP demo and trial
To get a fast, free demo, plus learn about how to get a free product evaluation for your facility, click below.


