COVID-19 NH data for week ending January 3, 2021 is now available and carries a date of January 14, 2021. This message is found at the top of the dataset: This Socrata-powered site may be unavailable for routine maintenance from Saturday, January 16, 2021 7:00 PM CST to Saturday, January 16, 2021 8:00 PM CST so be aware of this time period if you want to view the data this weekend.
![](https://ci5.googleusercontent.com/proxy/tueZ7b-OlmefoPDM892c-S8DV5jUuKDGI62vctE6AIwXvu_A2jsxsqY3ZtdjWtSiqCwc0kUlubVPYr-FzNH-bwlOi28crzmlUX6nBIhAHI90Qp36nEPIIyrDW56w=s0-d-e1-ft#https://briggshealthcare.files.wordpress.com/2021/01/picture1-54.png?w=560)
![](https://ci4.googleusercontent.com/proxy/puc7Yb-ofTNclZLHVfmcrRltfyMsWI_9CP3wlqbgbjEHnHaQGSLUErC6lH_1S0Ea2Qa3N8k1WoFBsoVITJwGzhoWpNpwKBOwbH35qRDyheCHikmdfpy-rhBigNyc=s0-d-e1-ft#https://briggshealthcare.files.wordpress.com/2021/01/picture1-55.png?w=560)
![](https://ci6.googleusercontent.com/proxy/I614BiWSZps0U-dL0f4Spso5G8T4NwL52Q9z96zsZ8q9bWD29phBbkbo2YXEM2cdWdJd8InhAge7MH0WosPcJHPQeE4_JzOI2u0Xdd_BotiJDVNa5M4zHLWQlnmq=s0-d-e1-ft#https://briggshealthcare.files.wordpress.com/2021/01/picture1-56.png?w=560)
![](https://ci4.googleusercontent.com/proxy/IZgSsmSNcb5A_kclljVu3HrTkzqCDL7IRgDfz4BrKtenf8h1gwcH77HL4EEgQLU_26B7w0uZNxAzu4zJTmQVA1LFS3dwetch5SipYqD8oaswvx1KxJ98kYLL3ezi=s0-d-e1-ft#https://briggshealthcare.files.wordpress.com/2021/01/picture1-57.png?w=560)
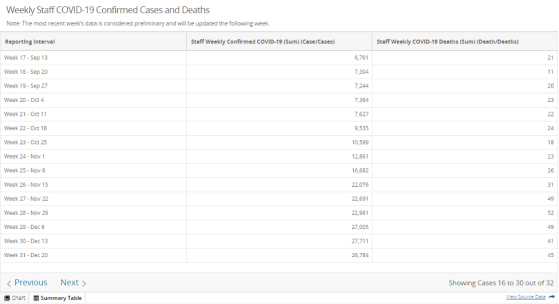
You’ll find this when you open the Summary Table (I used the Next option to show the last several weeks of data for staff cases and death):
![](https://ci4.googleusercontent.com/proxy/wqznfNe9KA2_e6MJU8Jgm7_usNKJhORCpAEHIijcjEM-azonUUxyfCcuf6IGffQo25oXjGjmHkmTVFhB7zRSwIwQrbt8jYFyZqK8_z4BMHetHtSAXk9PuFNXXpUu=s0-d-e1-ft#https://briggshealthcare.files.wordpress.com/2021/01/picture1-58.png?w=560)
![](https://ci3.googleusercontent.com/proxy/EE8COKTKQfjhHn-NZxsgqmiLxpHhapfMypjRKCElVyfYUXluAP5mytoCgSmNZ_b_kT-c6CXGbxG6T0G9hbBPvo2zk_uYnyn-nyb-qLPcIYierdUeHKjKfpftBvwG=s0-d-e1-ft#https://briggshealthcare.files.wordpress.com/2021/01/picture1-59.png?w=560)
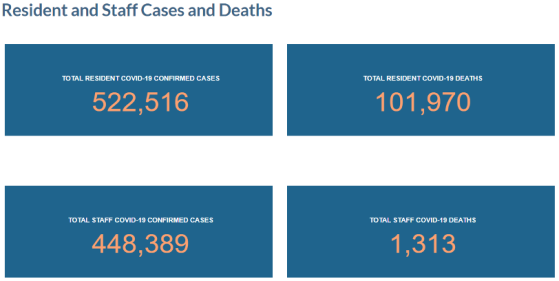
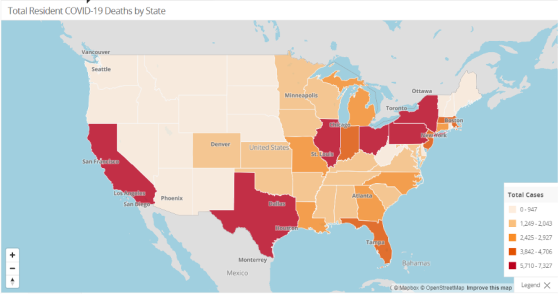
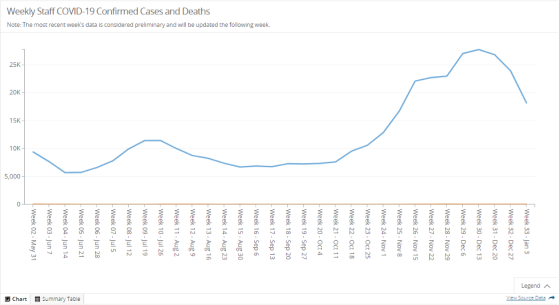
These graphs are found on the COVID-19 Nursing Home Data homepage. I excerpt them for inclusion in my weekly blog on the release of the latest data. A picture speaks a thousand words.